Place Advisory has analysed Brisbane’s $3 million plus real estate market and summarised the main points to give you an insight into where Brisbane’s wealthy are buying.
Summary
Over the last 12 months to June 2017 there have been 91 Luxury sales in Brisbane’s real estate market. This is made up of 66 luxury house and 25 apartment sales. During this period the most sales occurred in New Farm with 8 transactions while of the top 10 most active suburbs, Hawthorne had the highest average price of $5,472,500.
When looking at the last 10 years there have been 683 luxury sales which consist of 445 luxury house and 238 apartment sales. The majority of these occurred in Newstead. Hamilton however, had the highest average price of $4,666,750.
Brisbane’s Luxury Real Estate Market - 12 Months to June 2017
To maximise the use of this interactive map please open on a desktop computer or laptop
Figure 1: Interactive map showing combined luxury house and apartment sales over the last 12 months ending June 2017.
Prepared by Place Advisory. Source: PriceFinder
Both luxury houses and apartment average prices have remained relatively flat over the last 10 years to June 2017 and the sales numbers each year have been steadily increasing. Over the last 12 months to June 2017 the average luxury house price has decreased by approximately 4.5% to $3,984,507 while apartments have increased by approximately 9% over the same period to $4,123,126.
Brisbane’s Top Luxury Suburbs – 12 Months to June 2017
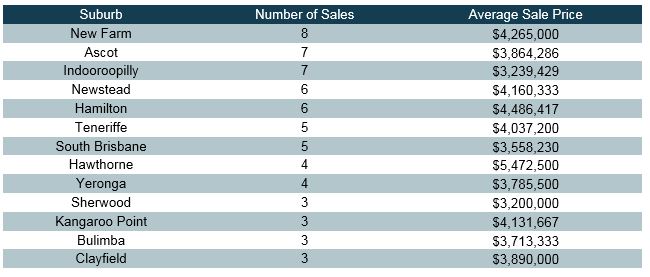
Table 1: Table showing combined number of sales of luxury houses and apartments by suburb and average prices over the last 12 months to June 2017. Prepared by Place Advisory. Source: PriceFinder
New Farm in Brisbane’s inner city area was the most active suburb recording 8 luxury sales and an average price for sales above $3 million of $4,265,000. However Hawthorne, which recorded four luxury sales, was the most expensive of these suburbs with an average luxury price of $5,472,500. Ascot (7), Indooroopilly (7), Newstead (6) and Hamilton (6) were the next most active suburbs.
Brisbane’s Luxury Real Estate Market – 10 Years to June 2017
To maximise the use of this interactive map please open on a desktop computer or laptop
Figure 2: Interactive map showing combined luxury house and apartment sales over the last 10 years ending June 2017.
Prepared by Place Advisory. Source: Price Finder
The map above shows the combined house and apartment luxury sales in Brisbane for the last 10 years to June 2017. Over this time there were 683 total luxury sales which is made up of 445 houses and 238 apartments. Similar to the last 12 months, the majority of luxury sales remain along the Brisbane River and close to the CBD.
Past 10 Years – Luxury House and Apartment Sales to June 2017
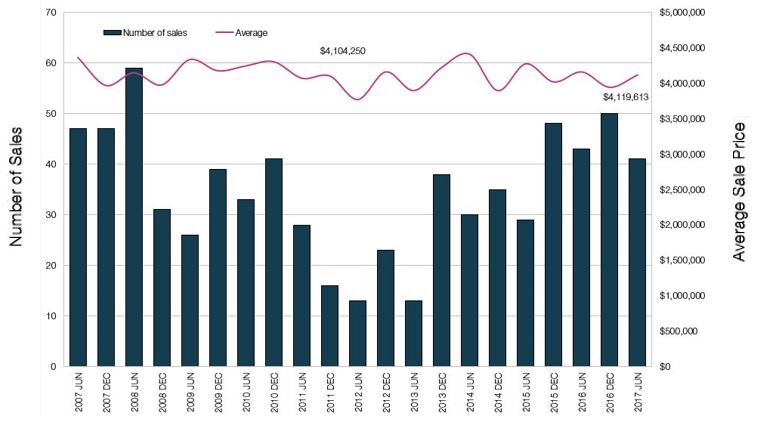
Figure 3: Chart showing combined luxury house and apartment sales over the last 10 years ending June 2017 and average prices by year.
Prepared by Place Advisory. Source: PriceFinder.
Recent activity in Brisbane’s $3 million plus market has been steadily increasing since a period of low activity in 2012. However, the combined price of luxury houses and apartments has remained relatively flat over the last 10 years with no major fluctuations in price.
Most Active Suburbs – 10 Years to June 2017
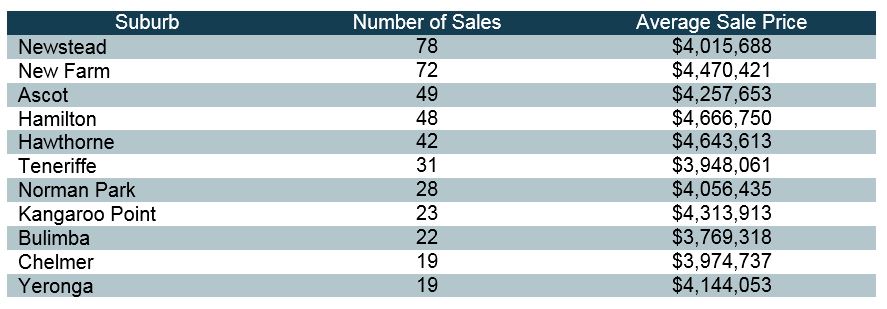
Table 2: Table showing combined number of sales of luxury houses and apartments by suburb and average prices over the last 10 years to June 2017.
Prepared by Place Advisory. Source: PriceFinder
The table above shows the most active suburbs for luxury house and apartment sales over the last 10 years to June 2017. Newstead was the most active recording 78 sales above $3 million with an average sale price of $4,015,688 in this price range. New Farm was the next closest with 72 sales, whilst Hamilton had the highest average luxury sale price of $4,666,750.
Brisbane’s Luxury House Sales
To maximise the use of this interactive map please open on a desktop computer or laptop
Figure 4: Interactive map showing the location of luxury house sales over the past 12 months.
Prepared by Place Advisory. Source PriceFinder
The map above shows the location of 66 luxury house sales in Brisbane over the past 12 months ending June 2017. As expected, the majority of these suburbs are within close proximity of the CBD and along the Brisbane River as they are both significant price drivers. However, there has been some activity away from these locations where luxury houses provide large pieces of land for those that prefer to escape from the busy city.
Most Active Suburbs – 12 Months to June 2017
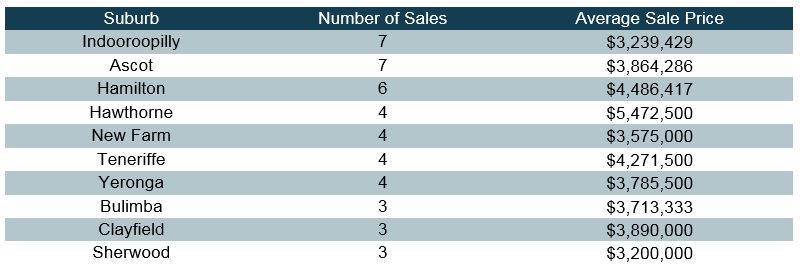
Table 3: Table showing the most active suburbs for luxury house sales in Brisbane and average prices over the last 12 months ending June 2017 and their average value. Prepared by Place Advisory. Source PriceFinder
The most active suburbs over the last 12 months ending June 2017 for luxury house sales were Indooroopilly (7), Ascot (7) and Hamilton (6). Each suburb is within 8km of the CBD and within close proximity of the Brisbane River. Of the top 10 most active suburbs Hawthorne had the highest average luxury house price of $5,472,500.
Past 10 Years – Luxury House Sales to June 2017
To maximise the use of this interactive map please open on a desktop computer or laptop
Figure 5: Interactive map showing luxury house sales over the last 10 years ending June 2017.
Prepared by Place Advisory. Source: PriceFinder
The map above shows the 445 luxury house sales over the last 10 years ending June 2017. The highest prices can be seen closest to the CBD.
Past 10 Years – Luxury House Sales to June 2017
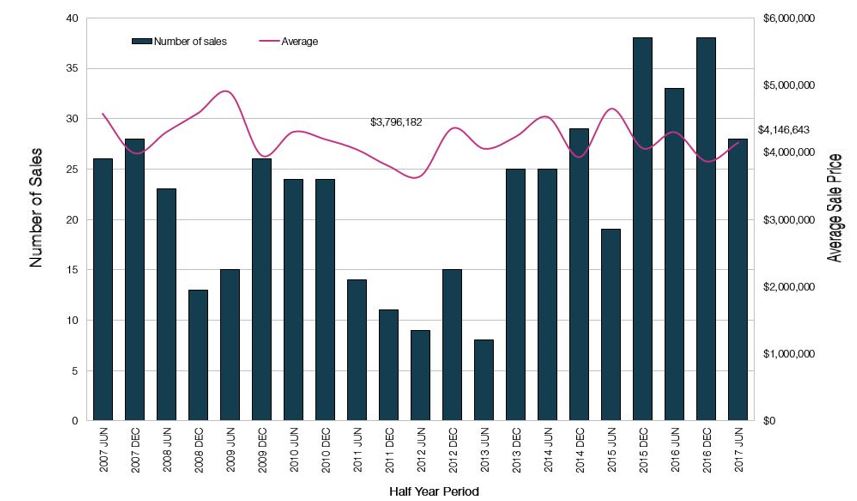
Figure 6: Chart showing luxury house sales over the last 10 years ending June 2017 and average prices by year.
Prepared by Place Advisory. Source: PriceFinder.
Luxury house sale numbers have been increasing steadily since 2012. However, the average price of a luxury house has not experienced any significant increases. The average price of luxury houses over the past 12 months to June 2017 has decreased by approximately 4.5% year on year to $3,984,507. However, it has increased by almost 7% compared to the same period five years prior.
The most active suburbs over this period have been Hamilton, Ascot and Hawthorne. However of the most active suburbs for luxury houses New Farm had the highest average price of $4,909,000.
Most Active Suburbs – 10 Years to June 2017
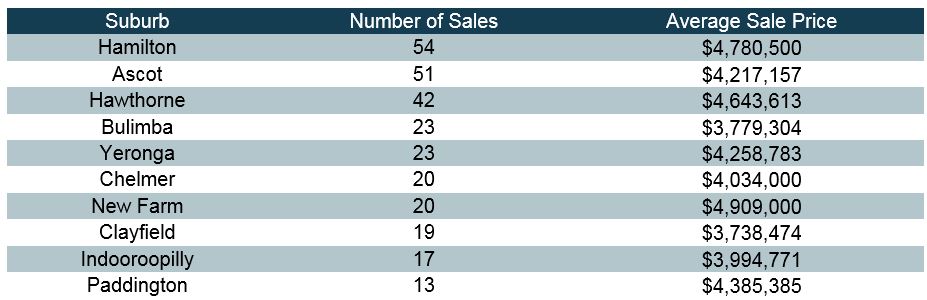
Table 4: Table showing the most active suburbs for luxury house sales in Brisbane over the last 10 years ending June 2017 and their average price.
Prepared by Place Advisory. Source PriceFinder
Luxury Apartment Sales
To maximise the use of this interactive map please open on a desktop computer or laptop
Figure 7: Interactive map showing Brisbane luxury apartment sales over the last 12 months ending June 2017.
Prepared by Place Advisory. Source: PriceFinder
Over the past 12 months to June 2017 there have been 25 luxury apartment sales. As expected, these are heavily concentrated around the CBD and the Brisbane River more than luxury houses.
Most Active Suburbs 12 Months to June 2017
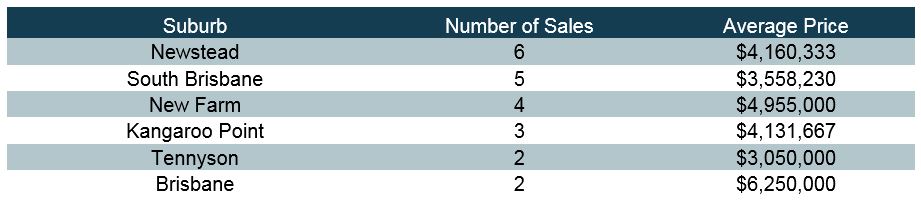
Table 5: Table showing the number of luxury apartment sales by suburb and the average price for the last 12 months ending June 2017.
Prepared by Place Advisory. Source: PriceFinder
Over the past 12 months Newstead has recorded the most luxury apartment sales with 6. This was closely followed by South Brisbane with 5. All of these suburbs with the exception of Tennyson are located in Brisbane’s most central suburbs. The most expensive suburb for the 12 months ending June 2017 was Brisbane with an average price of $6,250,000.
Past 10 Years – Luxury Apartment Sales to June 2017
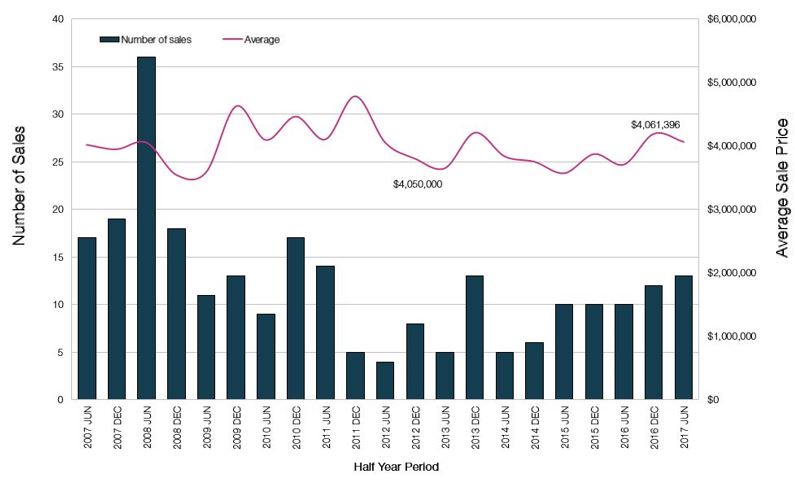
Figure 8: Graph showing the number of luxury apartment sales and average price over the last 10 years ending June 2017 for every six month period.
Prepared by Place Advisory. Source: PriceFinder
Luxury apartment sales have been steadily increasing since the trough of 2012. However, the average price of these apartments has remained relatively flat since the same period.
Over the past 12 months the average luxury apartment price has increased by approximately 9% to $4,123,126. However, it has decreased by approximately 8% since the same period 5 years prior.
Market Activity
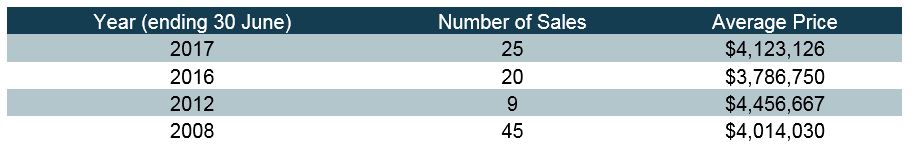
Table 6: Table showing the number of luxury apartment sales over $3 million by year and the average price.
Prepared by Place Advisory. Source: PriceFinder
Year on year there has been a 25% increase in luxury apartment sales as they recover from a period of limited activity in 2012. However, sales numbers are still well below the peak of 2008 which recorded 45 luxury apartment sales
To maximise the use of this interactive map please open on a desktop computer or laptop
Figure 9: Interactive map showing luxury apartment sales over the last 10 years ending June 2017.
Prepared by Place Advisory. Source: PriceFinder
Figure 9 shows the location of luxury apartment sales over the past 10 years ending June 2017. Over this period there have been 238 sales. While all suburbs are located along the Brisbane River the highest average prices can be found closest to the CBD.
Most Active Suburbs - 10 Years to June 2017
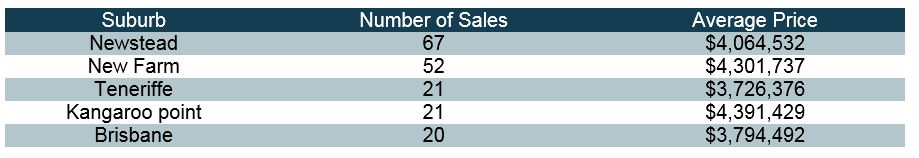
Table 7: Table showing the number of luxury apartment sales by suburb and the average price for the last 10 years ending June 2017.
Prepared by Place Advisory. Source: PriceFinder
The most active suburbs over the last 10 years ending June 2017 have been Newstead (67), New Farm (52), and Teneriffe (21) which are all located in a small pocket to the right of the CBD. However, of the most active suburbs, Kangaroo Point had the highest average price of $4,391,429.