The Inner Brisbane market is in the midst of change as it begins its transition into a new cycle despite the headwinds which remain with strict lending policies implemented by banks impacting sales volumes market wide. Apartment price have already begun to stabilise, aided by increased demand from population growth and comparatively affordable property prices with some market segments out performing. In this report, Place Advisory analyses apartment sales within a 5km radius of the Brisbane CBD and breaks them down into non-waterfront and waterfront sales, the latter of which has been outperforming.
Focusing on the Waterfront market, we begin with a look at performance over the past 10 years, where the market apartment market is heading and some market highlights.
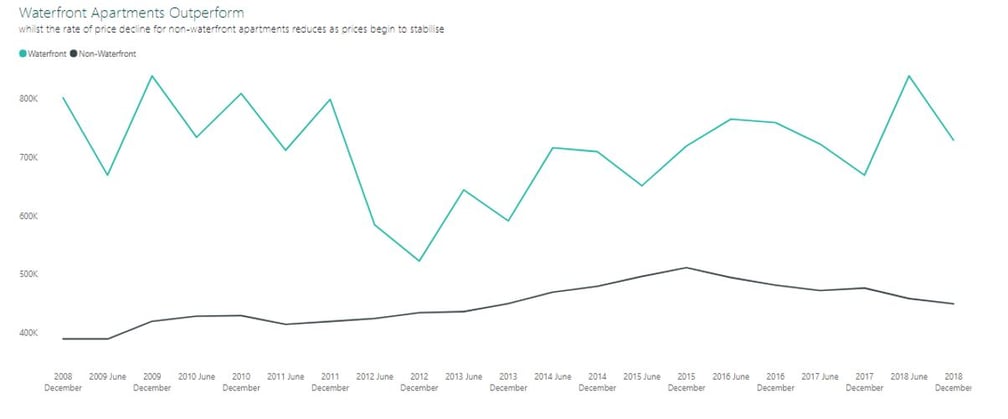
Despite Some Market Weakness Waterfront Apartments Outperform
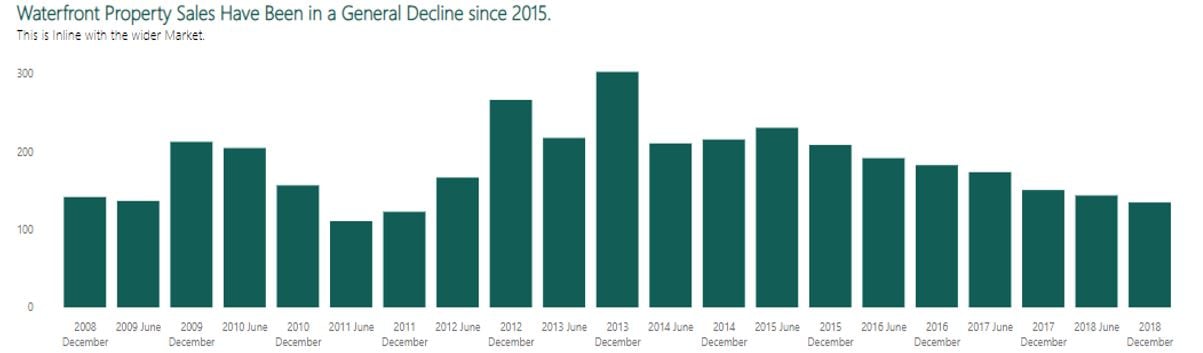
Although waterfront apartments generally have more desirability, they have not been immune to recent market weakness. The median waterfront apartment price softened in the 2018 December six-month period to $730,000 and sales volumes continued to decline slightly to 135 sales for the period.
Prepared by Place Advisory. Source: PriceFinder
However, the recent softening in median prices appears to be natural volatility due to the markets small size, as median prices remain on a general upward trend which started in the second half of 2012.
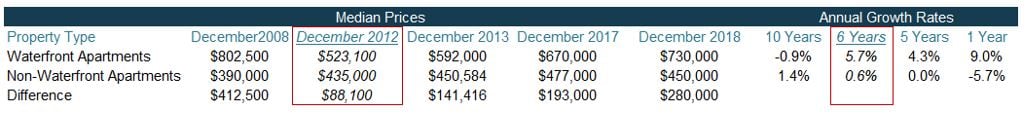
Even with the recent softening, the median waterfront apartment price is still 9% higher than it was 12 months ago and is approaching previous record highs. In comparison, non-waterfront apartments are 5.7% lower than they were in the same period 12 months ago and now sit at 2013 levels.
This difference in performance has rewidened the price differential between the two apartment categories to $280,000 which is more than triple what is was when the waterfront apartment market began its upward trend in 2012. Despite the current difference in median prices, it is still well below the maximum of the past 10 years of $420,000, indicating value remains in the sub-market.
Prepared by Place Advisory. Source: PriceFinder
The Waterfront Apartment Market Gains Popularity
Prepared by Place Advisory. Source: PriceFinder
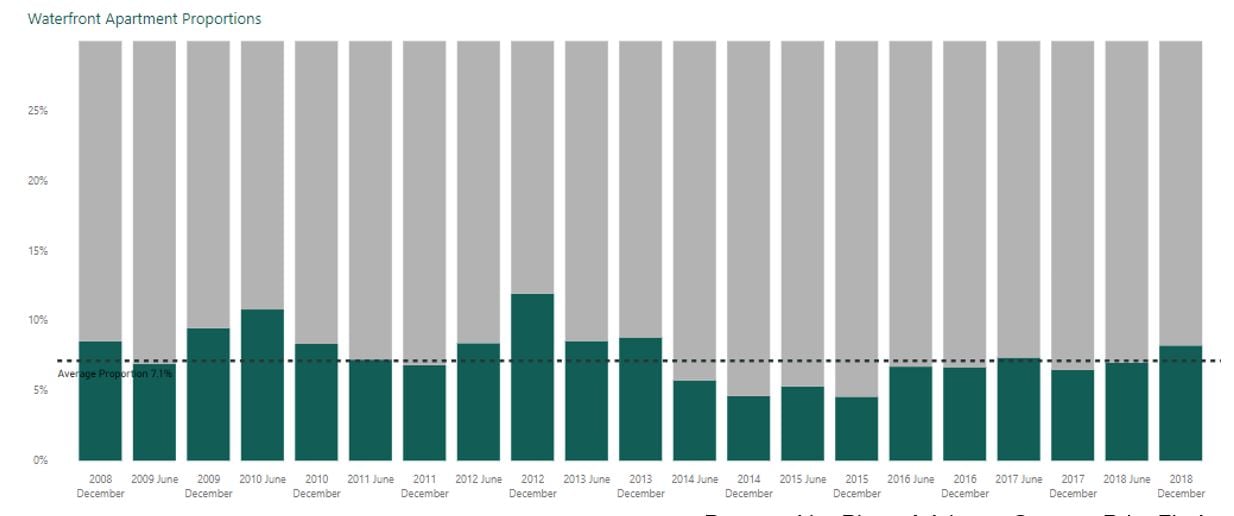
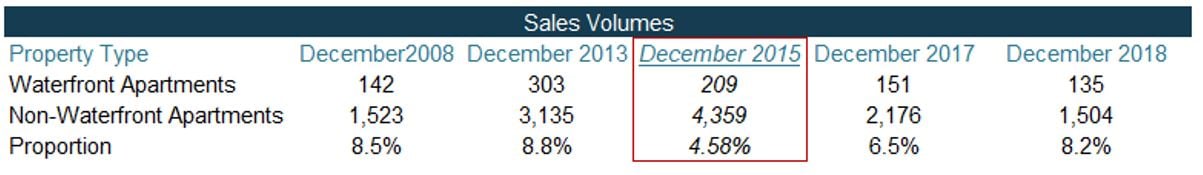
Supporting the growth in the waterfront apartment market is an increase in popularity reflected in the proportion of sales. Even though there has been an overall decline in sales volumes waterfront apartments have increased their market share of all apartment sales in the region from a low of 4.58% (209 waterfront apartment sales | 4,359 total apartment sales) in the December 2015 six-month period to 8.24% (135 waterfront apartment sales | 1,504 total apartment sales) in the December 2018 six-month period and is now above the 10 year average proportion of 7.1%.
Prepared by Place Advisory. Source: PriceFinder
This proportional increase comes as the non-waterfront apartment market has been experiencing steeper declines in sales volumes after the market peaked in the December 2015 six-month period, whereas the waterfront apartment market retained the majority of its demand due to its scarcity, prestige and reduced premium price during this time.
Prepared by Place Advisory. Source: PriceFinder
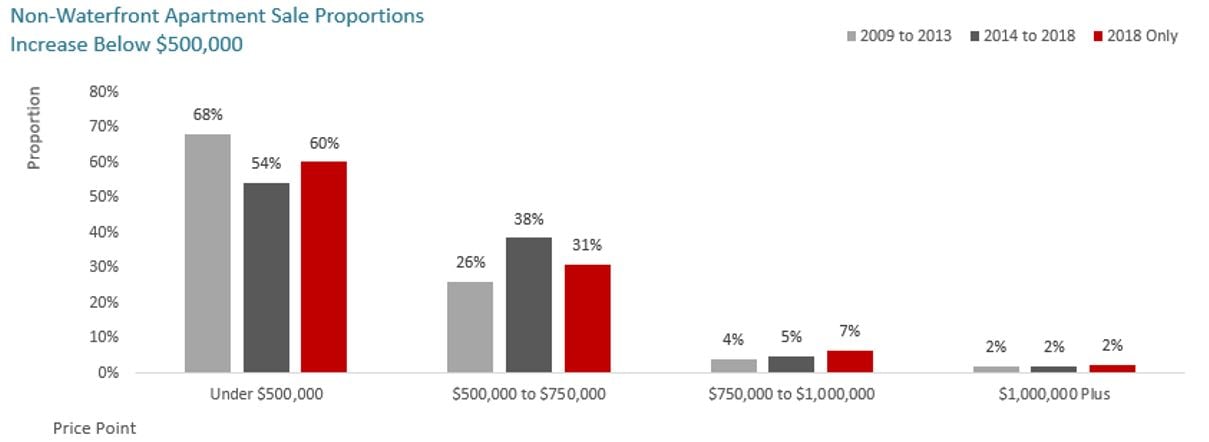
The Waterfront Apartment Market Sees Proportionally More Sales in Higher Price Brackets
Supporting the upward trend in median prices are increased proportions of waterfront apartment sales occurring in higher price brackets in 2018.
Waterfront apartment sales under $500,000 have become harder to come across, accounting for only 14% in 2018 whilst the $750,000 to $1,000,000 and $1,000,000 plus price brackets both increased their proportion. In 2018, 31% of waterfront apartments impressively sold for over $1,000,000.

Prepared by Place Advisory. Source: PriceFinder
In contrast, non-waterfront apartments have seen the proportion of apartments selling for under $500,000 increase as the $500,000 to $750,000 price bracket contracts. However, the higher price brackets either increased or remained steady indicating that it is the lower end of the non-waterfront market which is under the most pressure.
Prepared by Place Advisory. Source: PriceFinder
Waterfront and Better Quality Apartments to Continue to Outperform
Given the current property climate, lending policies and pending federal election sales volumes and investor activity are expected to remain subdued in the short term as the wider market gradually recovers. However, the significant reduction in sales volumes from the market peak and a slowing rate of decline, suggest that the market has for the most part already adjusted. This suggests that sales volumes will not fall much further and should begin to increase as the market moves through its natural cycle.
Inner Brisbane is expected to see low levels of new apartments physically enter the marketplace within the next few years, particularly post 2019, which when combined with the strong population growth currently occurring, will create further competition for property. As this occurs, the desirability of waterfront properties should see them outperform non-waterfront properties, causing the price differential to return to previous highs. This view is supported by our findings of a sustained shift toward higher quality and more expensive new apartments as owner occupiers become more prevalent in the market place.
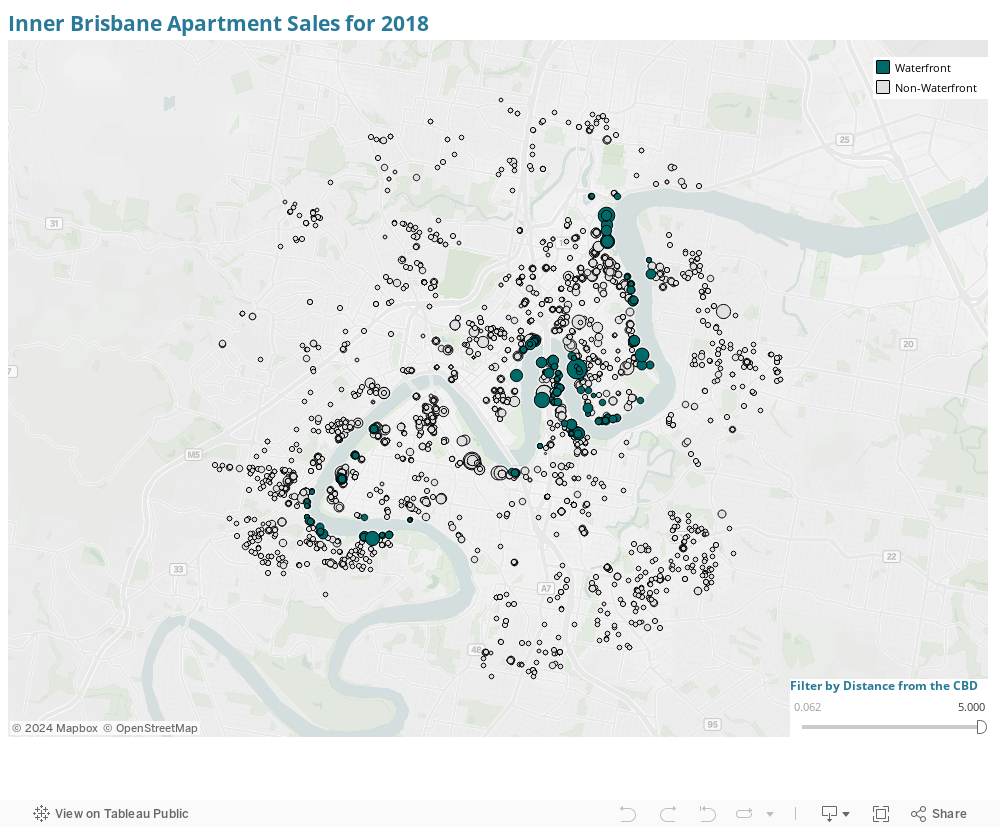
Interactive Map
To see the 2018 apartment sales geographically, categorized by waterfront, and scaled by sale price please use the interactive map below. Use the distance filter and zoom controls to refine your view.
Prepared by Place Advisory. Source: PriceFinder
The map clearly shows that Brisbane’s most expensive apartment sales are either riverfront properties or within close proximity of the Brisbane River.
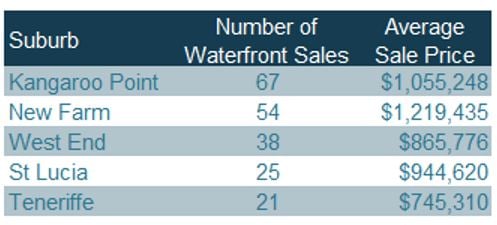
Five Suburbs with the Most Waterfront Apartments (5km from CBD)
Kangaroo Point, directly opposite the Brisbane CBD and surrounded by waterfront has topped the list of most waterfront apartment sales in 2018 with 67. This comes as no surprise given the density of apartments in the northern point of the suburb. New Farm, one of Brisbane most consistent performers and expensive property markets, closely followed with 54 waterfront apartment sales. Following significant apartment development, West End now offers a variety of waterfront properties and recorded 38 waterfront apartment sales for the year. The top five most suburbs in the table below consist of many apartment developments throughout and have large areas of waterfront.
Prepared by Place Advisory. Source: PriceFinder
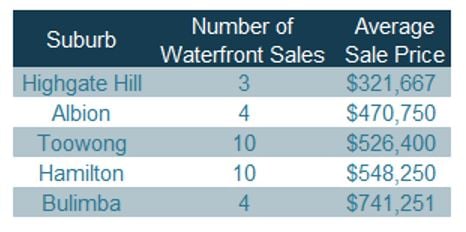
Five Cheapest Suburbs for Waterfront Apartments (5km from CBD)
Given the premium that buyers will pay for waterfront living, there are not too many locations still offering a bargain. However, we have revealed that there still exist small pockets offering affordable prices. Highgate Hill and Albion have been revealed as the suburbs with the most affordable waterfront apartments with an average price of $321,667 and $470,750 in 2018 respectively. However, waterfront apartments here are likely to be older in design.
Toowong and Hamilton still offer reasonable prices for waterfront apartments with an average sale price in the low to mid $500,000s in 2018. These suburbs are also likely to offer more options to choose from with established apartment precincts in each suburb. From here the average sale price for waterfront apartments steps up by almost $200,000 in Bulimba. In 2018, Bulimba recorded 4 waterfront apartment sales with an average sale price of $741,251.
Prepared by Place Advisory. Source: PriceFinder
Please note that waterfront sold within these suburbs but further than 5km from the centre of the Brisbane CBD are not included in calculations.
ConclUSION
We have broken down the Inner Brisbane 5km ring and analysed the performance of the waterfront and non-waterfront apartment market. The results have shown that that waterfront apartments have been outperforming over the past few years, seeing median prices approach previous highs. Despite falling sales volumes, the proportion of waterfront properties being sold is increasing supporting the strength in this market.
Moving forward, the waterfront market segment is likely to continue to outperform the rest of the region given their scarcity, desirability and their price differentials currently being below their peaks. However, as demand increases, and new supply dwindles, there is likely to be improvement market wide throughout 2019 and into 2020.