The Brisbane residential market has continued to change in 2017 as growth has been harder to come by. However, there have still been several well performing areas in each of Brisbane’s three rings. In this Instalment of Place Advisory’s Inner, Middle and Outer Rings report we have analysed the performance and demographics trends of suburbs in Brisbane’s three rings and provided a summary of the results.
Brisbane’s Inner Middle and Outer Rings
Source: RPdata, PriceFinder, ABS, Queensland Government. Prepared by Place Advisory.
The above map of Brisbane’s inner, middle and outer rings is interactive. For best viewing, click on full screen, then zoom in and click around to find demographic and median price information about different areas.
Source RPdata, PriceFinder, Queensland Government, ABS. Prepared by Place Advisory
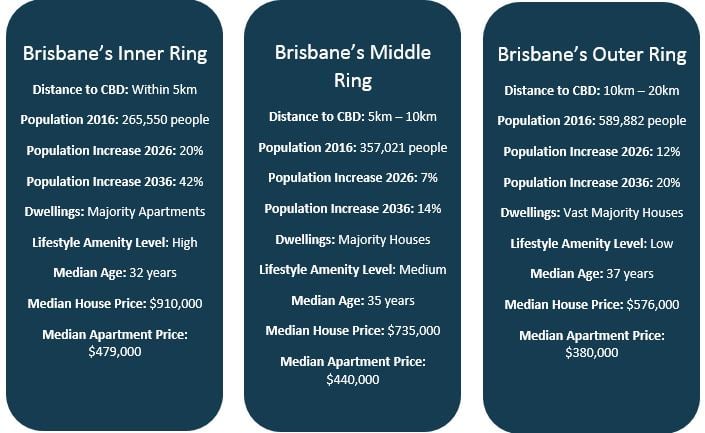
Population
As the resident population in Brisbane begins to increase at an accelerating rate, the data shows that it is Brisbane’s inner ring that stands to see the biggest population increase of 20% between now and 2026 and 42% between now and 2036. However, the largest increase in actual numbers will occur in Brisbane’s outer ring where the population is predicted to increase by approximately 118,000 people over the next 20 years.
Median House Prices and Sales Volumes for Brisbane’s Inner Middle and Outer Rings
The graph below shows median house prices and sales volumes per six month period for Brisbane’s inner, middle and outer rings dating back 20 years.
As has always been the case, Brisbane’s inner ring has once again recorded the highest median house price for the period ending September 2017. Currently, Brisbane’s inner ring has a median house price of $910,000, 24% higher than Brisbane’s middle ring, which recorded a median house price of $735,000 and 58% higher than Brisbane’s outer ring, which has a median house price of $576,000.
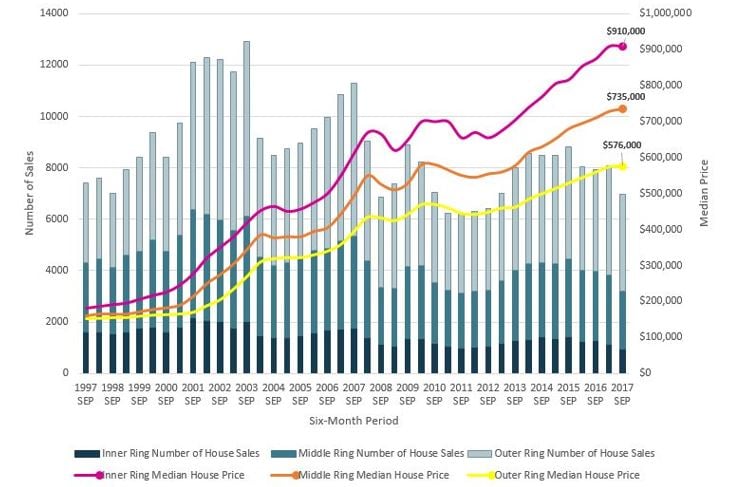
Source RPdata, PriceFinder. Prepared by Place Advisory.
Furthermore, during the same period, there were 955 house sales in Brisbane’s inner ring, 2,255 house sales in the middle ring and 3,763 house sales in the outer ring, resulting in 6,973 total sales for the period. Sales volumes are at their lowest levels since the September 2012 six month period, and were almost 2000 house sales below the 20 year average of 8,711 house sales per six month period.
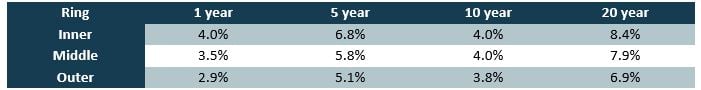
Average Annual Growth Rates in Median House Prices
Source RPdata, PriceFinder. Prepared by Place Advisory.
Brisbane’s Inner ring has seen the highest rate of growth in median house prices over the last 1, 5, 10 and 20 year periods. Over the past 12 months median house prices increased by 4% in Brisbane’s inner ring, 3.5% in the middle ring and 2.9% in the outer ring.
Median Apartment Prices and Sales Volumes for Brisbane’s Inner Middle and Outer Rings
Source RPdata, PriceFinder. Prepared by Place Advisory.
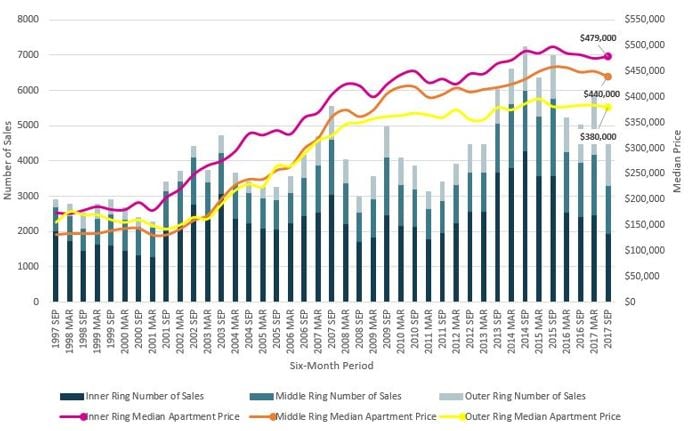
The graph above shows the median apartment price and number of sales per six month period for each of Brisbane’s three rings over the past 20 years.
Similar to the housing market, Brisbane’s inner ring is consistently the most expensive area for apartments, recording the highest median price of all three rings of $479,000. This is approximately
8% higher than the median price of $440,000 recorded for apartments in Brisbane’s middle ring, and 20% higher than the median apartment price of $380,000 for Brisbane’s outer ring.
After the surge of apartment development in Brisbane over the past few years, sales volumes are now returning to normal levels as fewer new apartments are being supplied to the market and the APRA’s restrictions on lending take effect. During the September 2017 six month period, there were 1,955 apartments sold in Brisbane’s Inner ring, 1,348 apartments sold in Brisbane’s outer ring and a further 1,207 apartments sold in the outer ring. The total of 4,510 apartment sales for the period still remain higher than the 20 year average of 4,025 apartment sales
Average Annual Growth Rates in Median Apartment Prices
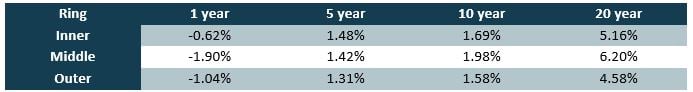
Source RPdata, PriceFinder. Prepared by Place Advisory.
Growth in median prices has been more subdued in Brisbane’s apartment market than the corresponding housing market. Apartments in Brisbane’s inner ring have performed the best out of the three rings over the past one and five year periods, with growth in median prices recorded at -0.62% and 1.48% per annum respectively. However, middle ring apartments have performed the best over the last 10 and 20 year periods recording median price growth of 1.98% and 6.2% per annum over these periods respectively.
Summary
The inner ring continues to record the highest prices and boast the best performing housing and apartment markets, while at the other end of the spectrum, the outer ring provides plenty of opportunities and a much more affordable entry point to those looking to enter the market.