Place Advisory is always keeping a close eye on Brisbane’s property market trends. In this short blog, we have created an interactive exploratory visualisation to see how individual Inner Brisbane apartments have performed compared to their area. In the following visualisation you can see ascertain many useful insights including at what price point the majority of apartment sales occur, have they achieved a gain or loss and how long they have been held. Most importantly, you can see how an individual apartment compares to the suburb/s you choose.
Please use the filters on the right to refine your search.
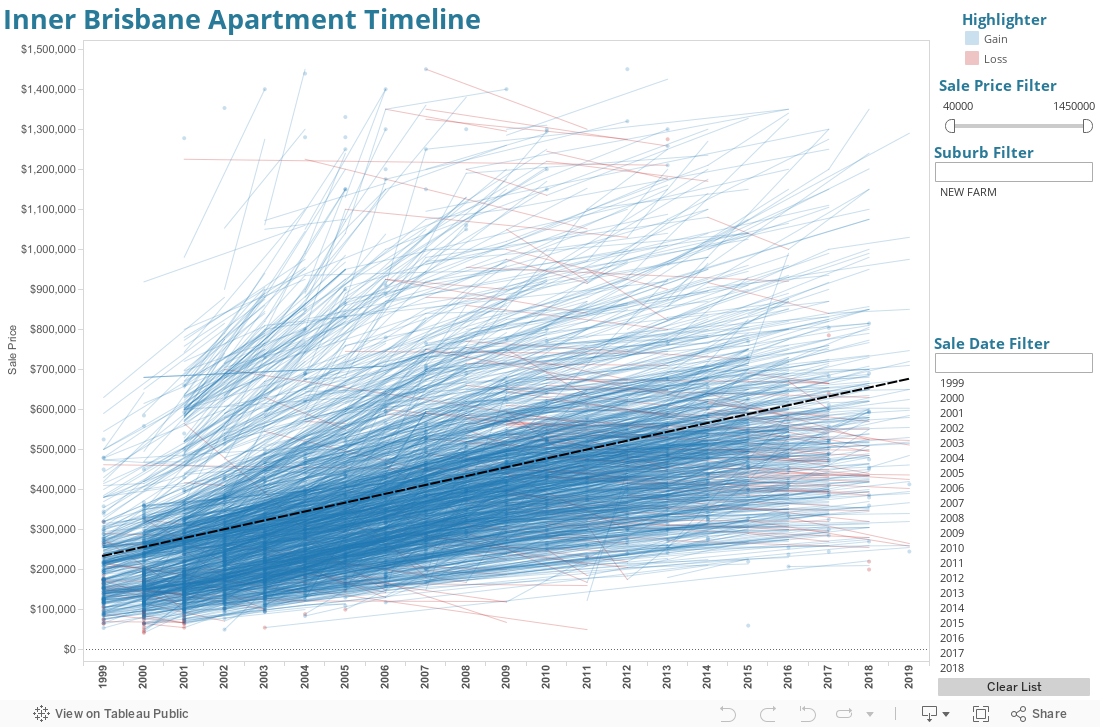
Summary
Overall, the average annual capital gain on Inner Brisbane apartment resales has remained low for the first six months of 2019 at 0.61% p.a. This is a result of minimal price growth over the past 10 years which has also led to increased holding periods compared to previous property cycles. It is clear that price growth in the last 10 years is very different to the preceding cycle. However, some suburbs have been performing admirably with Bulimba (4.3% p.a.) Hawthorne (3.2% p.a.), Spring Hill and Paddington (3.1% p.a.) and Alderley (2.7% p.a.) continuing to record solid gains over their apartment lifetimes.